AirSense
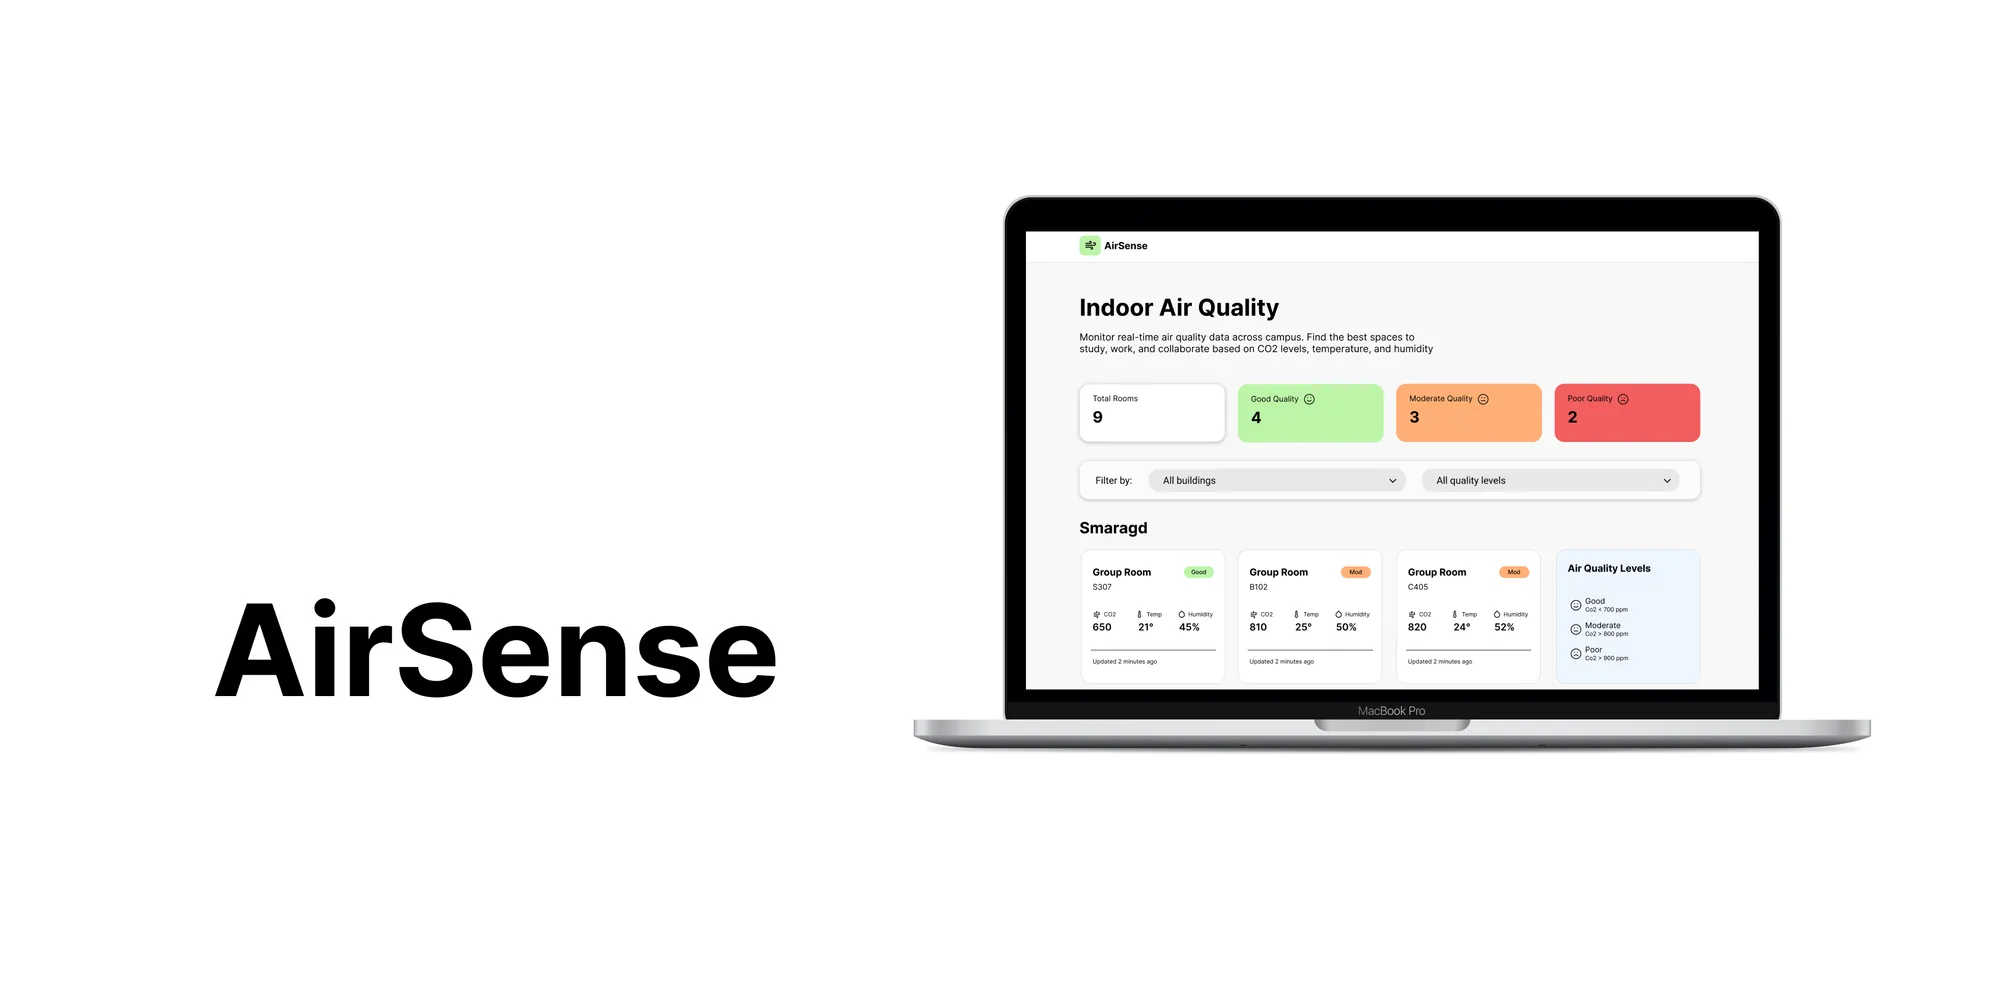
An IoT web app that visualises live air quality in rooms at NTNU Gjøvik — temperature, humidity and CO2 collected from micro:bit sensors.
01
Overview
- Project type
- IoT & web application
- Year
- 2025
- Role
- Frontend & web app development
- Team
- 4 — Emma Martine Troseth Glein, Mina Cecilie Mogen Øien, Saif Ali Rana and me
- Technologies
- micro:bit, Node-RED, MQTT, JavaScript, HTML/CSS
- Tools
- Figma, GitHub
GoalBring attention to indoor air quality by collecting live environmental data and making it readable at a glance in a web app.
02
The challenge
Poor air quality in classrooms and study rooms at NTNU Gjøvik is invisible — students and staff have no way of knowing when CO2 levels, humidity or temperature are affecting concentration and comfort.
Target usersStudents and staff using rooms at NTNU Gjøvik.
03
Research & understanding
- Looked into recommended thresholds for CO2, humidity and temperature in learning environments to set meaningful states in the interface.
- Tested sensor placement and reading intervals to find a balance between responsiveness and noise.
04
Process
01
Concept
Framed the problem around invisible air quality in shared rooms on campus.
02
Hardware
Wired temperature, humidity and CO2 sensors and processed readings locally on a micro:bit.
03
Data pipeline
Sent readings wirelessly over WiFi into a Node-RED based platform.
04
Web app
Built the interface that presents live values and their state, with Saif.
05
Physical model
Contributed to the design of the physical model used in the exhibition.
06
Presentation
Demoed the running system and gathered feedback.
05
Key decisions
- Prioritised a single glanceable status per room over dense charts — the app answers 'is the air okay right now?' first.
- Used colour states tied to real thresholds so the data is interpretable without prior knowledge.
06
Development
- Sensor data is processed on the micro:bit and pushed wirelessly to a Node-RED flow that normalises and forwards it.
- The web app subscribes to the live stream and renders current values with history for context.
- micro:bit
- Node-RED
- MQTT
- JavaScript
- HTML/CSS
07
Final solution
A working end-to-end IoT system: physical sensor unit, Node-RED data platform and a web app where anyone can follow temperature, humidity and CO2 for a room in real time.
The project received good feedback and gave the team hands-on experience with a full hardware-to-web pipeline.
08
Reflection
- What worked
- Splitting hardware and web app work while keeping a shared data contract kept the team moving in parallel.
- What did not work
- Early sensor readings were noisy and needed smoothing before they were usable in the interface.
- What I learned
- How to work in a team across hardware, data and frontend, and how much interface clarity depends on trustworthy data.
- What I would improve
- Add historical trends per room and alerts when values stay above threshold for longer periods.
- My contribution
- Shared main responsibility for the web app and helped shape the design of the physical model.
Next project
AI literacy test